Hi. Hey. Hello. This is the sixth edition of The Other 90. If you missed the first five, you can read them here.
JOB: I’m looking for a senior strategist with a background in social & digital to join my team at Annex88. The role is full-time and will be based in NYC once offices are a thing again. I’m particularly interested in folks that have experience with spirits or luxury brands. If you or someone you know is interested, feel free to reply to today’s email or reach out on social.
Let’s start here:
For a good portion of the 2010s, the word "viral" was inescapable in agency conference rooms across America. Sure, there were business objectives to attend to, and acquisition targets to hit, but for many brands, the spoken (and sometimes unspoken) judge of a campaign's success was its ability to "go viral." This was (and still is) especially true of campaigns that involve social media, the inarguable proving ground of all things viral, from dresses with indiscernible colors to sea shanties.
Now there are a lot of problems with the goal of going viral, and we don't have the space to dissect them all today. But the one thing that feels like it has not been acknowledged enough is this: Going viral, especially as a brand, is hard.
Sure, you can plan and you can gimmick it up, but at the end of the day, you are trying to compete in an attention economy in which you are woefully lacking control. The sooner we accept that our competition is less Starbucks versus Dunkin and more Starbucks versus literally anyone or anything putting content into my phone every day, the better off we are when it comes to understanding how little room for virality there really is in our daily dose of consumption.
All of that needed to be said before I said this: While the phrase "going viral" may no longer be viral in the advertising community, the expectation for a big spikey brand-defining Oreo-Super-Bowl billion-impression Cannes-Shorty-Webby-Clio winning idea is never going to go away. And that's where I think I can help.
A few years ago, my team, like yours, was getting a lot of briefs with vague "big reach" objectives and little in the way of a framework for getting there. So we decided to amass our case study libraries and look at the biggest, best, and most lauded campaigns that drove virality and/or heat around a brand. What we found across dozens of campaigns were three factors that drove success:
Novelty. The more newness or uniqueness to a brand story, a product, etc, the better. In fact, we also found that perceived newness worked, too.
Scarcity. The inaccessibility to product, information, or some other aspect of a story always made people want it more. This can also refer to the cost - as in the fact that a high cost would lead to less of something being owned or in existence. Once again, the perception of scarcity worked, too.
Influence. This became our biggest X-factor. Was the media spend massive? Did an A-list celebrity back the product? How much of a hold on the category did the brand already have? Influence was defined many different ways, but it was always the rocket fuel that really set things aflame.
So. Bingo. We had our 3 factors that we knew could drive virality. Alone, each could do a little something special, but together we knew they were creating heat.
If we had stopped there, it probably would have been fine. But instead, we wondered what it would take to quantify virality. Could you turn these factors into a measurable formula that could create comparisons, or predict the potential heat an idea could create?
The short answer is yes, and if you click the link at the word yes and never come back to this post I won't blame you. But for those who stay, here's the long answer:
Do you remember the quadratic formula? You used to use it in math class a lot. The formula is generally represented as ax²+bx+c=0, and it makes really pretty graphs like this:
A few paragraphs ago, I mentioned that going viral is hard. My team and I wanted to be able to utilize a scale that reflected that difficulty, and the quadratic formula seemed like a good solve. We assigned each factor a letter:
a = scarcity
b = novelty
c = influence
Then, to create a peak of heat versus a valley, we inverted the equation. So now it looked like this:
By scoring novelty, scarcity, and influence each on a scale of 1 to 5 (1 being least, 5 being most) we were able to create a consistent view of how drastic a peak in brand heat could be created.1
Finally, to help make the results easier to demonstrate, we decided to normalizing the output as a tangible number from 1-10 instead of a potentially confusing graph. This is important: We aren’t just adding up the scores out of 15, but instead we enter those totals into the quadratic formula to help show the weighted difficulty of hype.
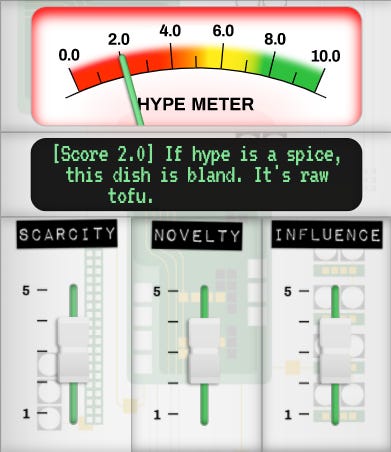
Feel free to open up TheScienceOfHype.com while we walk through some case studies. As a baseline, if you give a 3 out of 5 in all three categories, your normalized hype score would only be a 2 out of 10.
Case 1: A Product
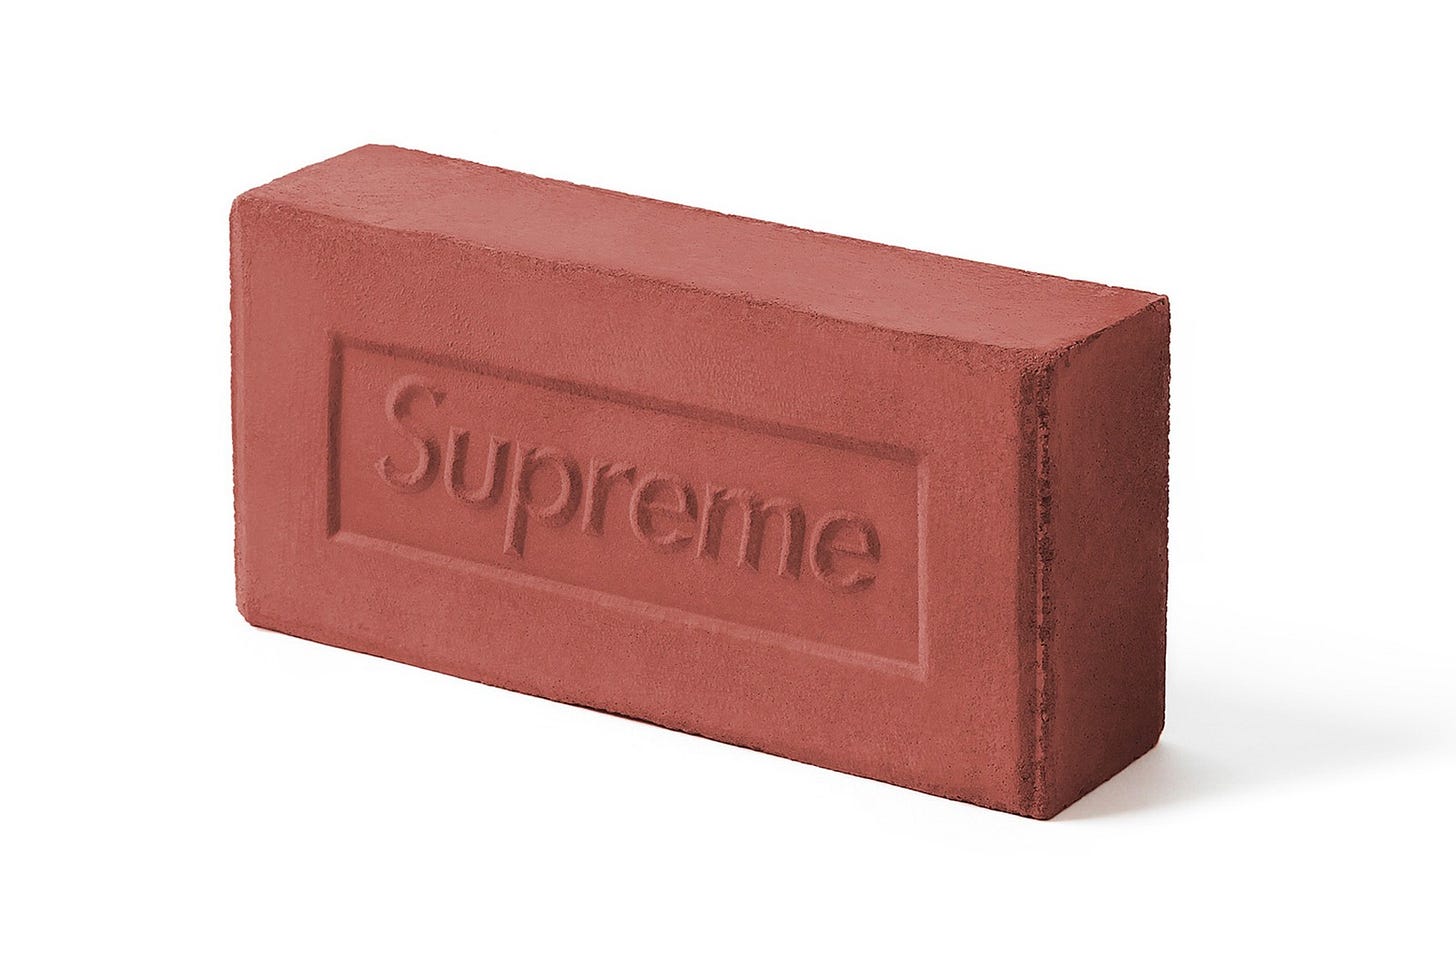
The Supreme Brick from 2016 (or basically anything Supreme until VF finds a way to mess it up)
Scarcity: There were very few Supreme Bricks made, but not only one. We'll go 4/5.
Novelty: The weirdness of Supreme releasing a brick was all over the internet and memed. Definitely unique. 5/5
Influence: Supreme has made its name as the brand for hyped items, no matter their actual usefulness. The brick only added to this allure. 5/5
Hype score: 5.1 (really good!)
Case 2: A Brand
The Explosion of Fashion Nova (pre-2018)
Scarcity: The products Fashion Nova sold at the time were generally fairly available except for certain circumstances. 2/5
Novelty: Fashion Nova became known as a place you could find the knockoff version of something sold elsewhere. 2/5
Influence: Fashion Nova spent tons of $$$ courting influencers with product, and invested heavily in social advertising. This spend created outsized share of voice despite the lackluster product it was supporting. 5/5
Hype score: 2.0 (A level of hype unsustainable long term - and a score that would be higher today because Fashion Nova now does exclusive collaborations with big names which drives up scarcity and novelty)
Case 3: Changing Hype Over Time
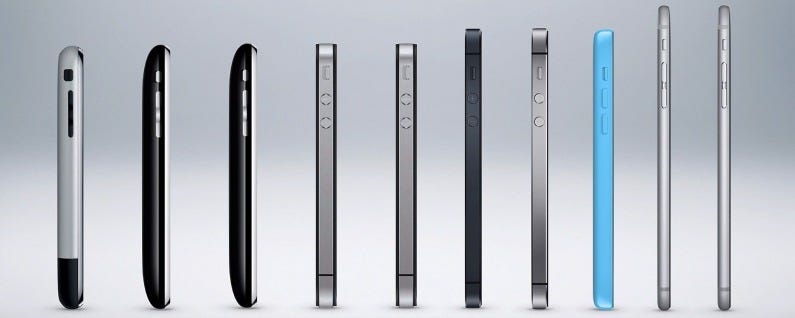
iPhone Then
Scarcity: The first iPhones were incredibly scarce and also expensive which drove down accessibility. 4/5
Novelty: Early iPhones genuinely had features no other phones had at the time. 5/5
Influence: Apple was not previously a phone carrier so it lacked standing in the category, but it did have a decent media spend. 3/5
Hype score: 3.9 (pretty good!)
iPhone Now
Scarcity: It is no longer difficult to get your hands on an iPhone, and the cost has largely been mitigated by contracts with carriers. 1/5
Novelty: Many other phones can do what iPhones do today, and in some cases they can do it better. 2/5
Influence: Apple's run of devices has made it the dominant figure in the smartphone space. 5/5
Hype score: 1.6 (less good)
Case 4: Meme Culture
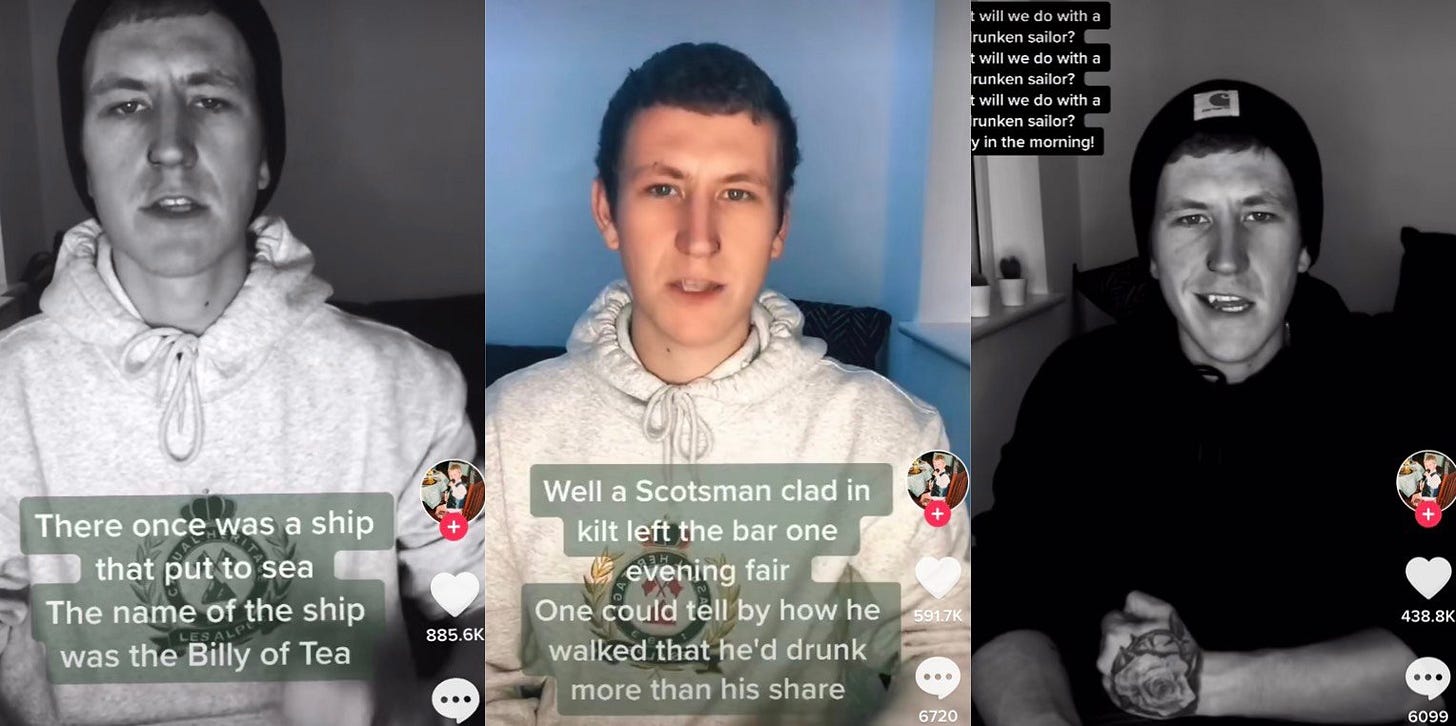
@nathanevanss (Sea Shanty Guy)
Scarcity: While TikTok is flooded with musicians of all kinds, available content around this genre was extremely low in general popular culture. There is also a scarcity of the song itself - the original clip is short enough to make people want more. 5/5
Novelty: We have a Scotsman singing a song the majority of TikTok users have never heard of and doing so a cappella. So accent, niche song, niche genre, but in a popular format. 4/5
Influence: At first, Nathan was going it alone. But the ability to duet his song meant that it could spread incredibly quickly and also rope in users at an alarming rate. Over time, this led to media pickup thanks to TikTok's domination of cultural conversation, and the rest was history. 5/5
Hype score: 8.8 (good golly he cracked it)
I hope this gives you an interesting framework to use when thinking about gaining traction around an idea, product, launch moment or otherwise. The science is, of course, not really science, and therefore is not perfect, so I would love to hear what you think of our model! Sound off in the comments or bother me somewhere on social media.
Before I go, I want to be sure to thank Katey, Kari, and other alumni of the Annex88 strategy team for their help in building out the initial thinking of The Science of Hype a few years ago. I’d also like to thank Harry Bee for pushing the idea forward, Kenny who gave The Science of Hype a visual aesthetic and the Emerging Tech team at Havas for building the website (especially James & Danny).
The Other 90 is written by Rob Engelsman, a former baby model and now the VP, Head of Strategy & Strategic Partnerships at Annex88 in New York City. You can find him on Twitter, Instagram, & LinkedIn.
There’s more to be said here about exactly how A, B and C impact how the graph looks and where it moves, but we were more interested in the peaks versus the total makeup of the graph itself and our math nerding stopped here.


